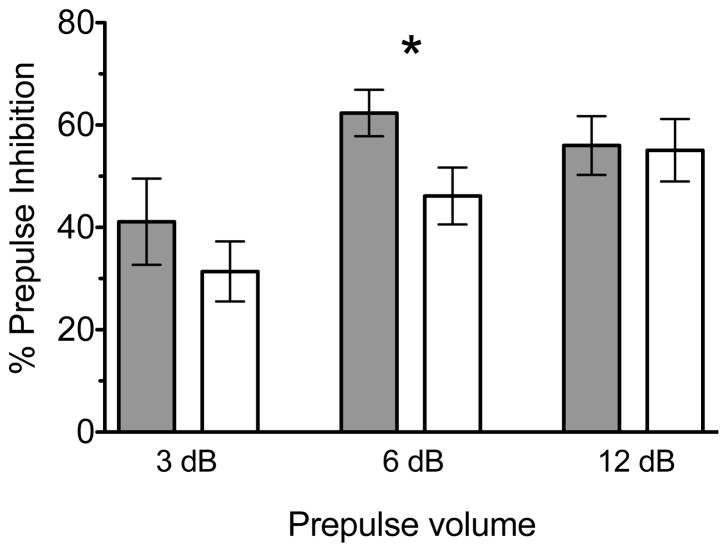
Figure 1.
Between-group planned comparisons at each level of prepulse volume show a significant difference in % PPI at the 6 decibel (dB) prepulse level (t = −2.220, p < 0.05), indicating a significantly lower PPI in isolated rats than in socially-reared controls (* p < 0.05, n = 9 per group, data is represented as mean ± S.E.M). Prepulse volume denotes the decibel level of the prepulse above background noise. Group-reared animals are represented by grey bars while isolates are represented by white in the histogram shown.

