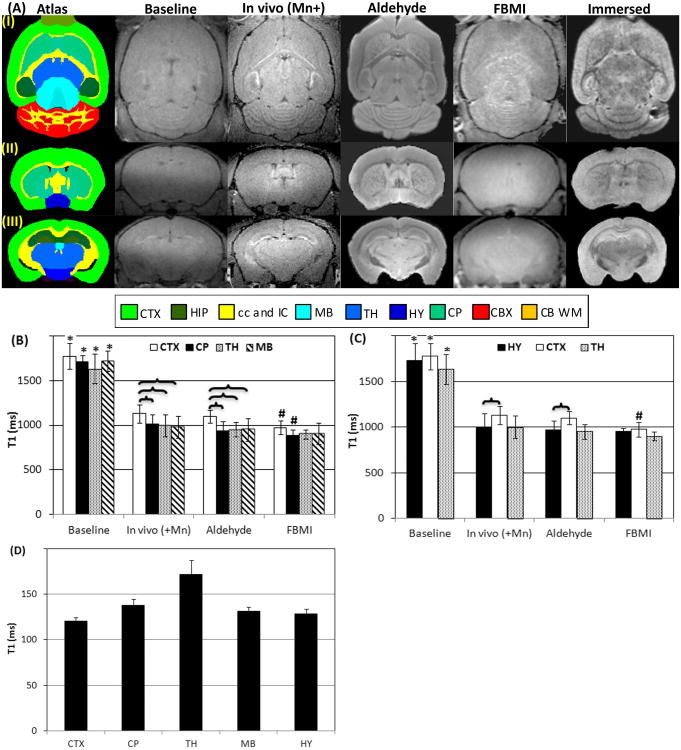
Figure 1.
(A) Row (I): Axial slices include the structures of CTX, CP, TH, MB and cerebellum; Row (II): Coronal slices show CTX, CP and HY; Row (III): Coronal slices show CTX, HIP, TH and HY. From left to right: Column 1 is the mouse brain atlas from UCLA LONI; Column 2 shows the baseline MRI; Column 3 is the in vivo MRI of a Mn2+ infused mouse; Column 4 is the ex vivo MRI of a mouse fixed using an aldehyde fixative; Column 5 is an animal fixed by FBMI; and Column 6 is the ex vivo MRI of a MnCl2 immersed brain. (B) T1 values on CTX, CP, TH and MB measured in baseline MRI, in vivo manganese enhanced MRI (in vivo (+Mn)), ex vivo MRI of animals fixed using chemicals and FBMI. (C) T1 values on HY, CTX and TH. (D) T1 values in MnCl2 immersed brains.
*: significant difference between baseline scans and in vivo manganese enhanced measurements
#: significant difference between in vivo manganese enhanced measurements and ex vivo scans after fixation
 : significant difference between two structures.
Abbr. in Figure 1: CB WM - cerebellar white matter, CBX - cerebellar cortex, cc – corpus callosum, CP – caudoputamen, CTX - cerebral cortex, HIP – hippocampus, HY – hypothalamus, IC – internal capsule, MB – midbrain, TH - thalamus

