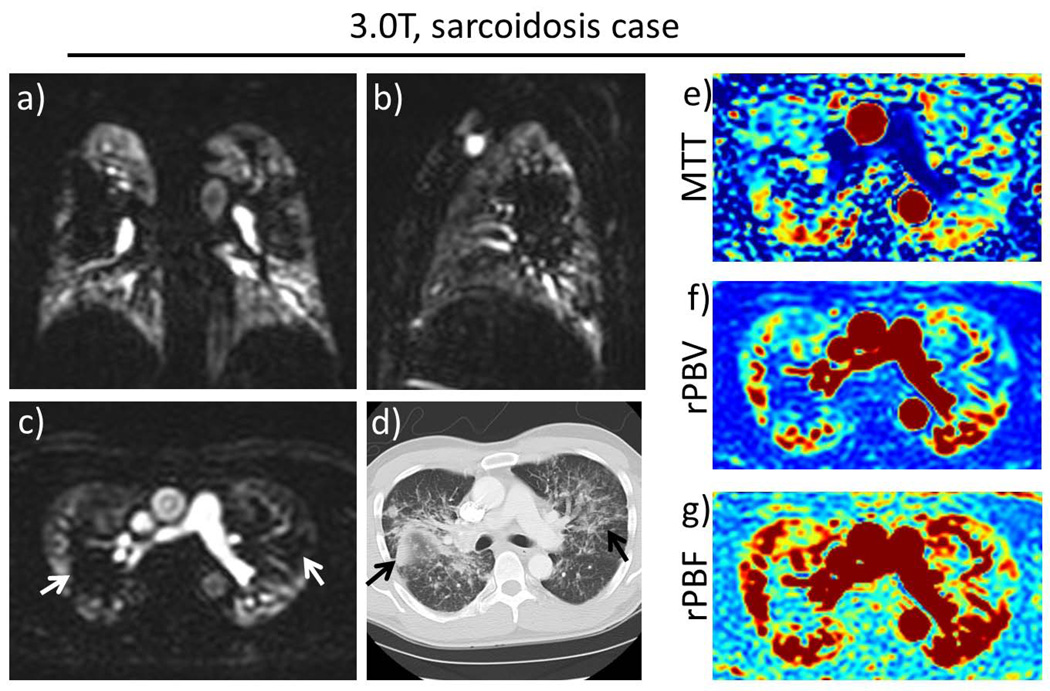
Figure 3.
Patient volunteer with sarcoidosis. Representative slices in (a) coronal, (b) sagittal and (c) axial views at the peak parenchymal enhancement phase. Large perfusion defects in the central regions of both lungs (white arrows), corresponding to (d) the areas of fibrosis seen on CT (black arrows). The perfusion maps (e–g) for the same axial slice also show the defects.

