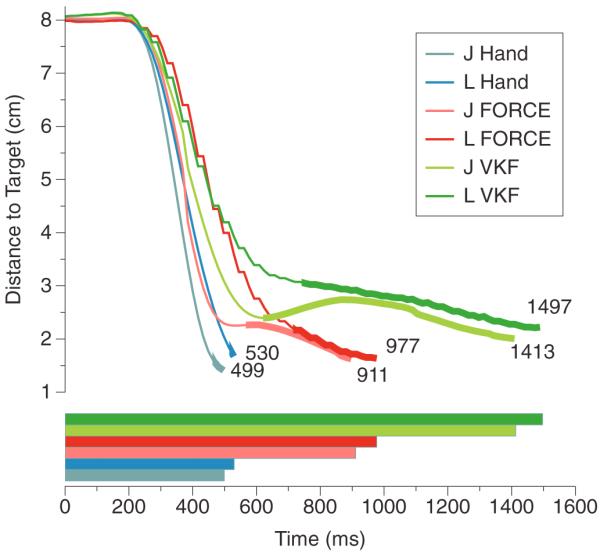
Figure 3.

Mean distance to target. Top—the distance (cm) of the arm to the target at each time point averaged across all trials and reach directions for both monkeys. The thicker line is the duration between the first time the monkey acquired the target and the final time the monkey acquired the target. Light blue and blue show monkey J's and L's native hand performance. Light red and red show the FORCE decoder's performance for monkeys J and L in BMI mode. Light green and green show the VKF's performance for monkeys J and L in BMI mode. Bottom—the average last acquire times for both monkeys under all three conditions. Average last acquire time measures how long on average it takes the monkey to complete the task.
