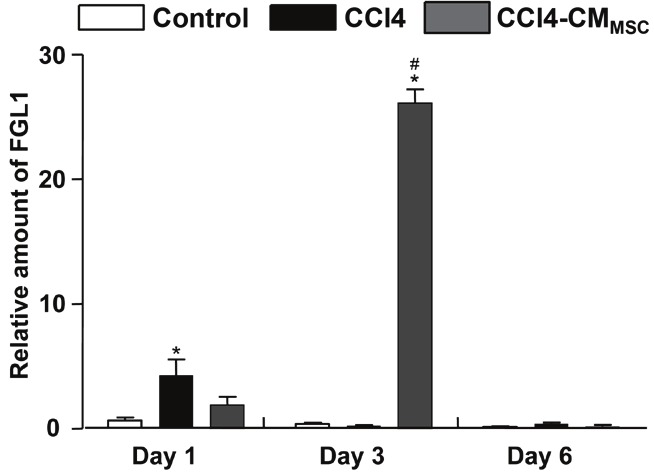
Figure 6.

Relative mRNA expression of FGL1 in primary hepatocytes derived from untreated (control), CCl4-treated mice and CCl4-treated mice supplemented with CMMSC and was analysed by real time PCR. Values are expressed relative to GAPDH expression. Total RNA was extracted at days 1, 3 and 6 from primary hepatocytes and was analysed by real time PCR. Values are the mean ± SD of triplicate measurements *, #P<0.05 compared with the control and CCl4 groups respectively.
