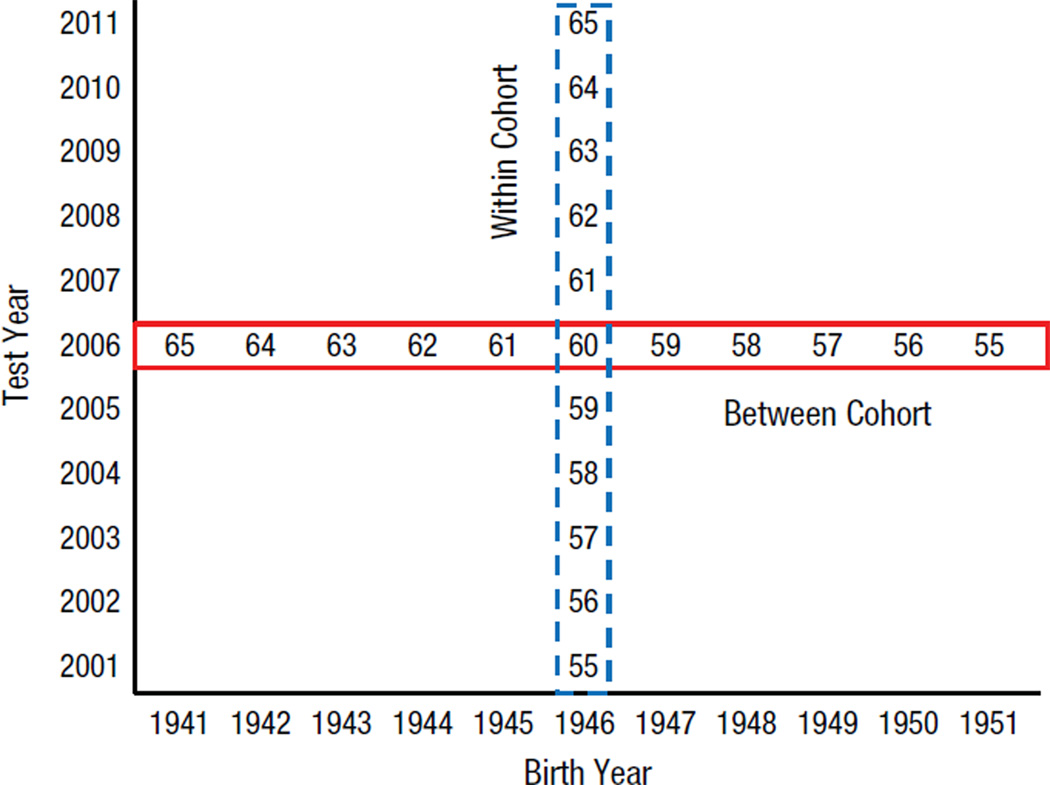
Fig. 1.
Illustration of the structure of the data in the current project. Although the birth years ranged from 1907 to 1989, only a limited number of birth years are illustrated for the sake of clarity. Each cell in the matrix consists of data from different people. Thus, comparisons along a row are between cohort, because they involve people who were of different ages (and thus born in different years) but who were tested in the same year; comparisons along a column are within cohort, because they involve people who were of different ages (but born in the same year) and who were tested in different years. The numbers in the cells correspond to the ages of individuals from the indicated birth and test years.

