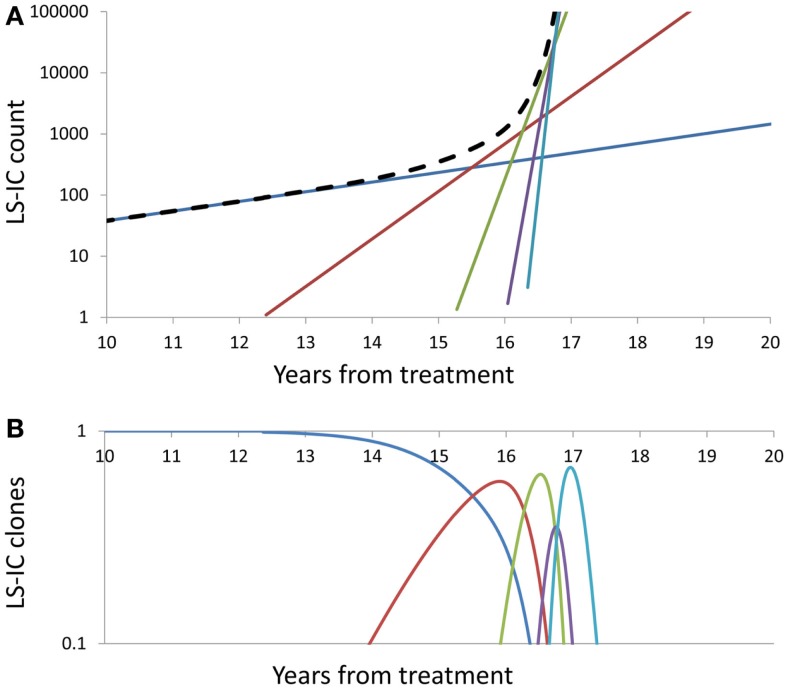
Figure 3.
Summary of successive driver mutations in the natural course of the SCN → sMDS → sAML transition. (A) Counts Ni(t) of cells in successive mutant clones, under model as in Eq. 7 with A = 0.02, ε = 0.2, and k = 2. Straight lines with increasing slopes: counts of cells in successive mutant clones. Thick dashed line: Total mutant cell count. (B) Relative proportions ni(t) = Ni(t)/ΣjNj(t) of cells belonging to successive mutant clones. Further details as in the Section “Mathematics of the Model.”

