
Figure 1.
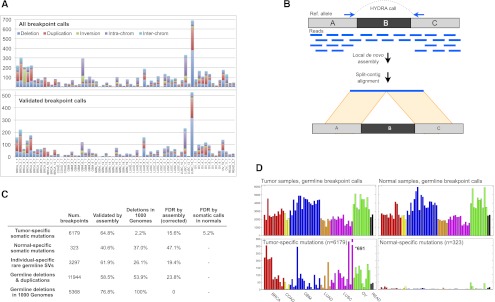
HYDRA-MULTI breakpoint calls. (A) Stacked bar graph displaying the number of SVs in each tumor, with different SV classes shown as different colors. The top plot has all SV calls; below are the calls validated by assembly. In the legend, deletions, tandem duplications, and inversions are smaller than 1 Mb; (intra-chrom) intra-chromosomal rearrangements larger than 1 Mb; (inter-chrom) inter-chromosomal rearrangements. (B) Assembly-based validation of a breakpoint call corresponding to deletion of the “B” segment. Read pairs in which one or the other read maps near a breakpoint prediction are extracted and subjected to de novo assembly. Contigs are then aligned to the reference genome. Split alignments detecting breakpoints consistent with the original call are judged as validated. (C) Table showing the validation results for different breakpoint callsets. From top to bottom, the rows correspond to somatic mutations predicted in a single tumor sample, “somatic mutations” predicted in a single normal sample, SV calls present in a single tumor–normal pair, germline control breakpoints, and germline deletion calls that were also found by the 1000 Genomes Project. The “Deletions in 1000 Genomes” column shows, for each subset of calls shown in rows, the percentage of deletions that were also found by 1000 Genomes, defined as 50% reciprocal overlap. The last two columns show the FDR by assembly, and by assessing the number of normal specific somatic mutations. (D) The top two panels show the number of germline breakpoint calls found in tumor (left) and normal (right) samples. The bottom panel shows the number of breakpoint calls found in a single tumor sample (left), but no other sample, or a single normal sample (right).