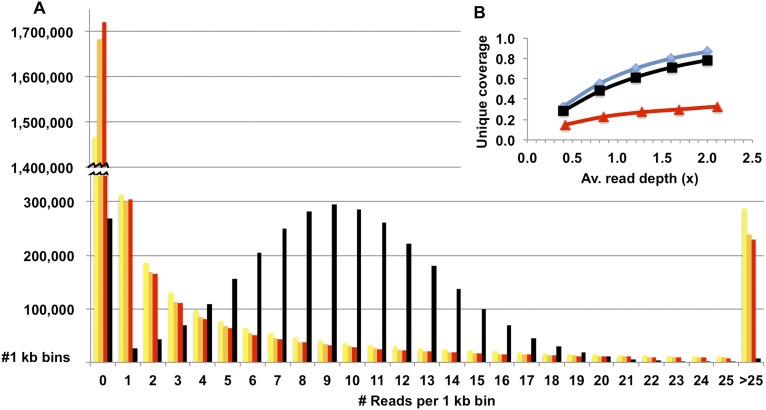
Figure 2.
Genome coverage of mapped sequence reads from amplified sperm DNA and unamplified blood DNA. (A) Distribution of mapped reads from amplified DNA of three haploid sperm cells (yellow, orange, and red bars) and unamplified DNA from blood cells (black bars) after dividing the reference genome into nonoverlapping bins of 1-kb length. (B) Unique genome coverage with increasing read depth for libraries prepared from a single sperm cell (▴) or diploid blood cells (■). The ideal mapping to a nonrepetitive genome is included for comparison (♦).

