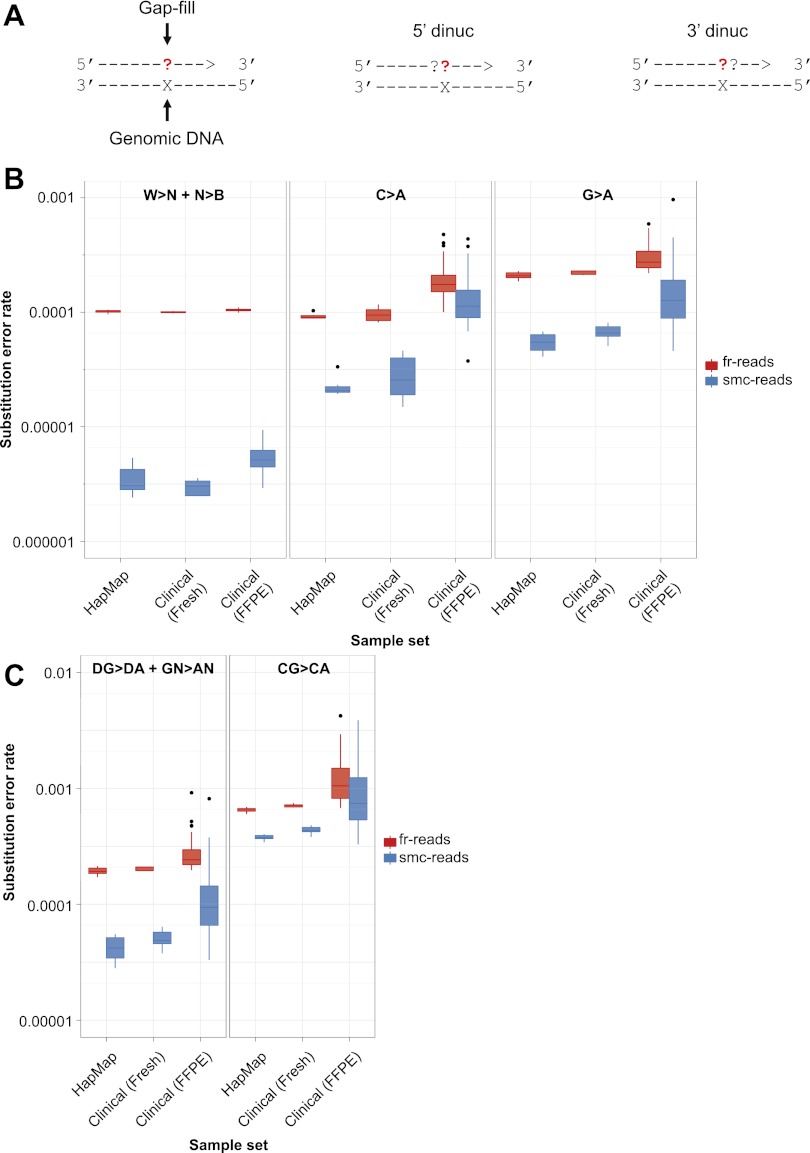
Figure 3.
Substitution error rates as a function of expected and observed nucleotide during gap-fill. (A) Schematic illustrating mononucleotide and dinucleotide substitution dependencies being considered. All rates are shown for a given expected gap-fill mono- or dinucleotide, which is the complementary nucleotide(s) to the nucleotide(s) present in the target genomic DNA, considering only ≥Q41 fr-read base-calls and Q60 smc-read base-calls at putative homozygous positions based on GATK calls. (B) Distributions of substitution error rates for eight HapMap cell line and 45 clinical cancer samples, comparing fr-reads and smc-reads, and all substitutions other than C>A or G>A (W>N + N>B, left) to only C>A (middle), or G>A (right). (C) Distributions of substitution error rates comparing fr-reads and smc-reads, and all G>A substitutions occurring in the non-CG dinucleotide context (DG>DA + GN>AN, left) to G>A substitutions occurring only in the CG dinucleotide context (CG>CA, right).

