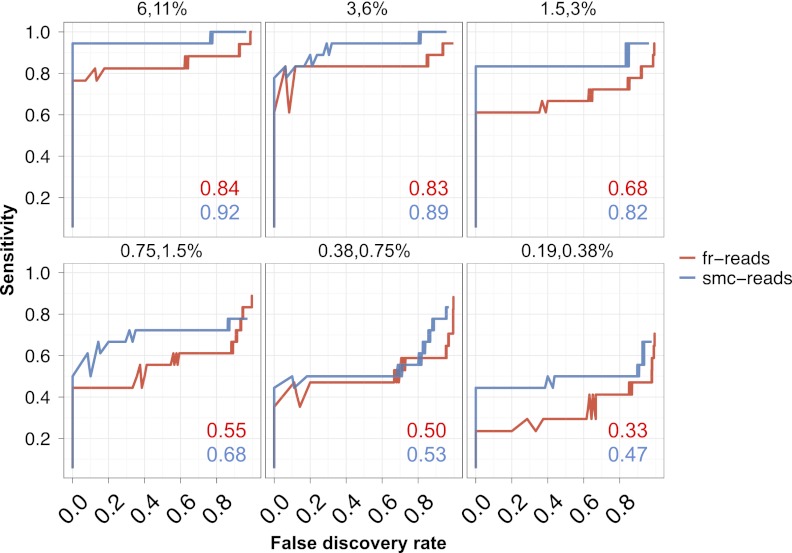
Figure 4.
Sensitivity and false discovery rates for subclonal variation in synthetic mixtures. Sensitivity versus false discovery rate for low-frequency variants (0.1%–40%) in synthetically mixed HapMap samples for variant calls from fr-reads (red) and smc-reads (blue), for coding positions that were adequately genotyped in both unmixed HapMap samples and for which there was no substantial (binomial adjusted P < 10−10) subclonality in the predominant HapMap sample. Expected subclonal variant frequencies are listed at the top of each panel. Area beneath the curve is shown as an inset in each panel. Candidate subclonal variants occurring in coding sequence and at a frequency of at least 0.1% were prioritized using multiple testing-adjusted binomial P-values that were calculated from substitution error rates.

