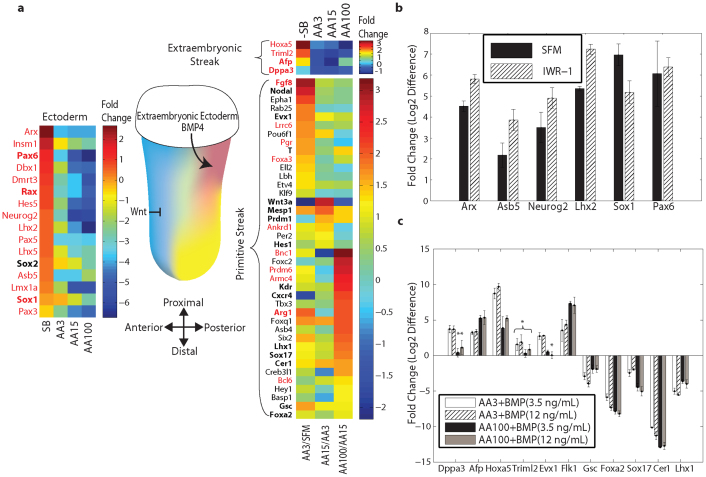
Figure 5. Lineage segregation between neuro-ectoderm and PS (mesoderm and definitive endoderm) achieved by modulation of Activin A/TGFβ signaling pathway.
(a) Schematic of the mouse embryo at embryonic day 6.5–7.5 with the gradient of Nodal expression (yellow) with the maximum expression observed in the anterior tissue. Through inhibition of TGFβ signaling pathway cells commit to the neuro-ectoderm lineage (blue). A heat map of the neuro-ectoderm associated genes is depicted (left of the embryo) with their fold changes in different samples in comparison to untreated control. The heat map on the right of the embryo depicts successive fold changes of the PS markers with varying dosages of the Activin A. The transcripts with the highest fold change in AA100 in comparison with AA15 are enriched for definitive endoderm and other anterior tissue markers. Other PS transcripts are expected to have diffused expression pattern all throughout the streak. Genes with known expression in Theiler stages 9–11 of mouse embryo are highlighted in bold (MGI database). Low copy number transcripts (RPKM < 3 in the AA3 sample) are displayed in red font. (b) Small molecule inhibition of Wnt signaling pathway (IWR-1) induced the neuro-ectoderm lineage. The fold changes are normalized to the AA3 sample. (c) BMP4 enhanced expression of posterior and extraembryonic mesoderm markers at the expense of anterior markers. Quantitative RT-PCR fold changes for two BMP4 dosages are normalized with respect to Activin A alone induction. Error bars represent the standard deviation in biological replicates (n = 3). Asterisks indicate p > 0.05 (Student's t-test) compared to controls.

