
Figure 4.
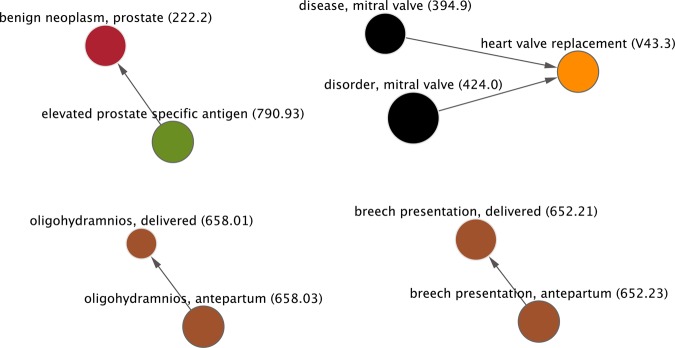
Subset of network graph using the same threshold for criteria as in figure 2 except with a time frame for events between two nodes set at 1–30 days apart. Thus, any relationship >30 days apart would be excluded. The entire graph contains 255 nodes and 203 edges. The view shown here contains nine nodes and five edges. The names of nodes are shown as well as the ICD-9 code in parentheses. ICD-9, International Classification of Diseases, Ninth Revision.