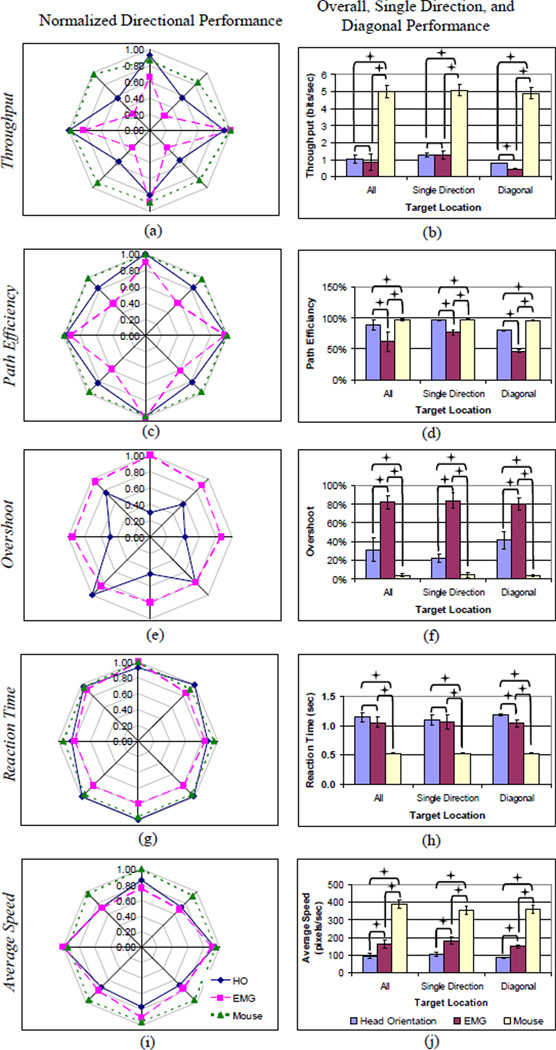
Fig. 7.
Plot of normalized command source performance by target direction (left column) and overall average, single direction, and diagonal performance (right column). In the left column, ideal omni-directional performance is illustrated as an octagon, with departures representing decreased performance in that particular direction. In the right column, pair-wise comparisons across command sources of overall, on axis and diagonal performance are noted with brackets. Those comparisons that are significantly different (p<0.05) within the marked groups are denoted with a star

