
Figure 1.
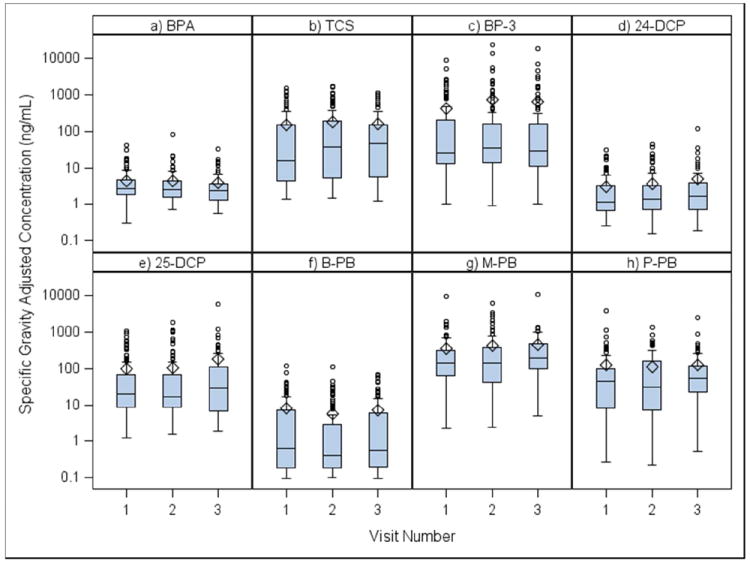
Boxplots comparing SG-adjusted concentrations of urinary biomarkers across study visitsa.
aVisit 1 (20 ±2 weeks gestation), Visit 2 (24 ±2 weeks), Visit 3 (28±2 weeks)
Official websites use .gov
A
.gov website belongs to an official
government organization in the United States.
Secure .gov websites use HTTPS
A lock (
) or https:// means you've safely
connected to the .gov website. Share sensitive
information only on official, secure websites.
Boxplots comparing SG-adjusted concentrations of urinary biomarkers across study visitsa.
aVisit 1 (20 ±2 weeks gestation), Visit 2 (24 ±2 weeks), Visit 3 (28±2 weeks)