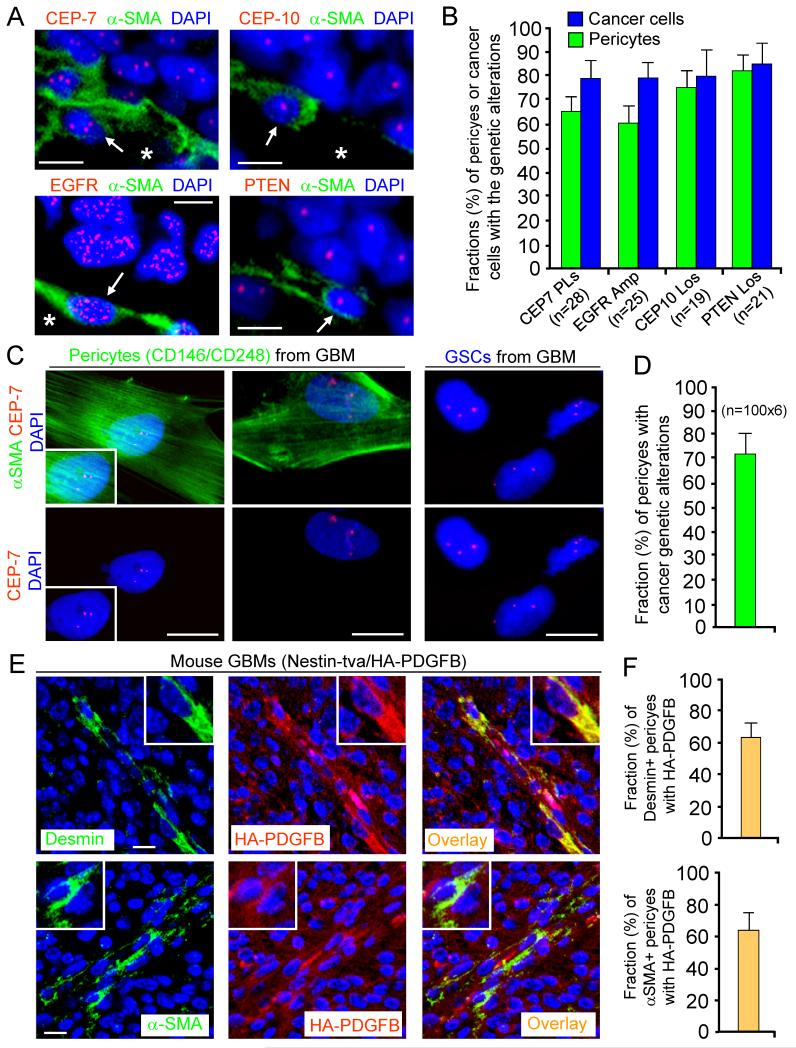
Figure 4. Pericytes Are Commonly Derived from Neoplastic Cells in Primary GBMs.
(A and B) FISH analyses of genetic alterations with the CEP-7, CEP-10, EGFR or PTEN probe (in red) in pericytes (α-SMA+) in primary GBMs. Quantification shows average fractions of pericytes carrying the cancer genetic alterations (CEP-7 polysomy; EGFR amplification or trisomy; CEP-10 loss; or PTEN loss) in GBM tissue arrays (B).
(C and D) FISH analyses with CEP-7 probe in sorted pericytes (α-SMA+) and GSCs from primary GBMs. Quantification shows the fraction (mean 72%) of pericytes carrying the GSC genetic alterations (D).
(E and F) Imf staining of a pericyte marker (Desmin or α-SMA) and the HA-tagged PDGFB in the genetically engineered mouse GBMs (Nestin-tva/Ink4a/Arf−/−/HA-PDGFB model). Quantifications show fractions (mean 63%) of HA-PDGFB+ pericytes (F)
The scale bars represent 10 μm (A and C) and 25 μm (E). The error bars represent SD. See also Figure S5.

