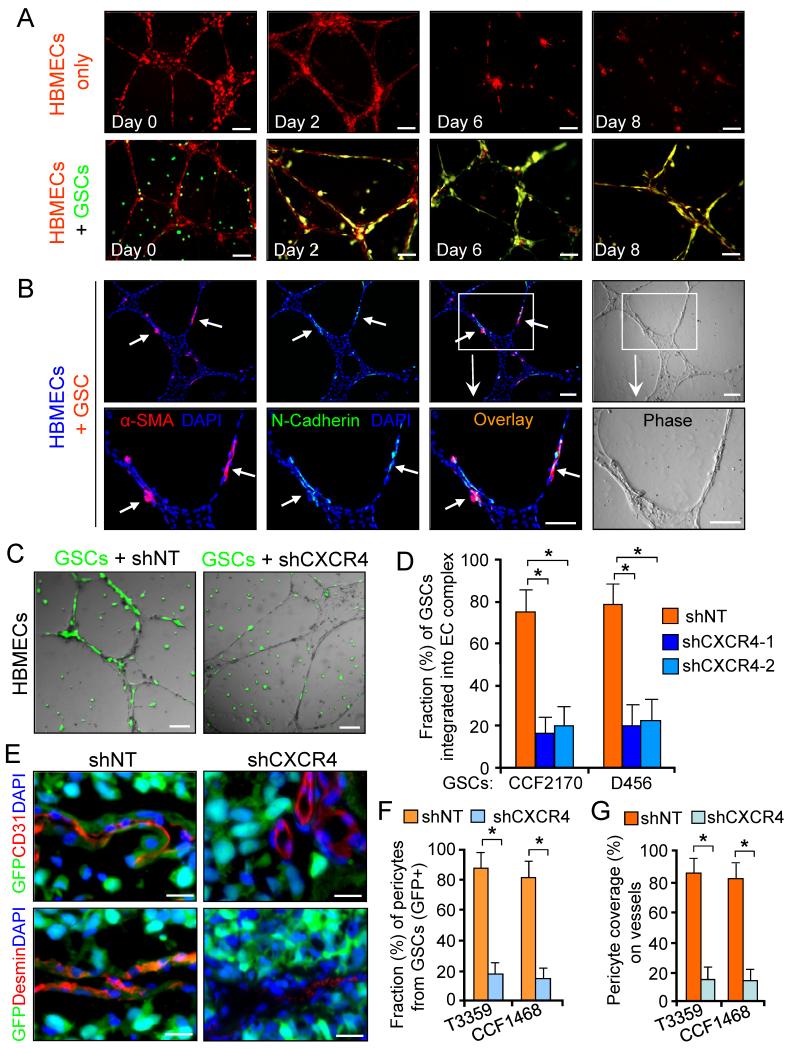
Figure 6. GSCs Are Recruited toward ECs through the SDF-1/CXCR4 Axis to Support Endothelial Complex.
(A) In vitro endothelial complex formation of HBMECs (labeled with red fluorescent tracer CMTRX) with or without GSCs (labeled with CFSE, in green).
(B) Imf staining of α-SMA and N-Cadherin in complexes of HBMECs and GSC-derived cells. Nuclei were stained with DAPI.
(C and D) Endothelial complexes of HBMECs with GFP-labeled GSCs expressing shCXCR4) or shNT. Quantification shows fractions of GSC-derived cells (GFP+) on HBMEC complexes (D). *, p < 0.001.
(E-G) In vivo lineage tracing of GSCs with GFP constitutive expression and Imf staining of CD31 or Desmin in tumors derived from GSCs expressing shCXCR4 or shNT. Quantifications show fractions of GSC-derived pericytes (GFP+) (F) and total pericyte coverage (G) on vessels. *, p < 0.001.
The scale bars represent 100 μm (A-C) and 25 μm (E). The error bars represent SD. See also Figure S7.

