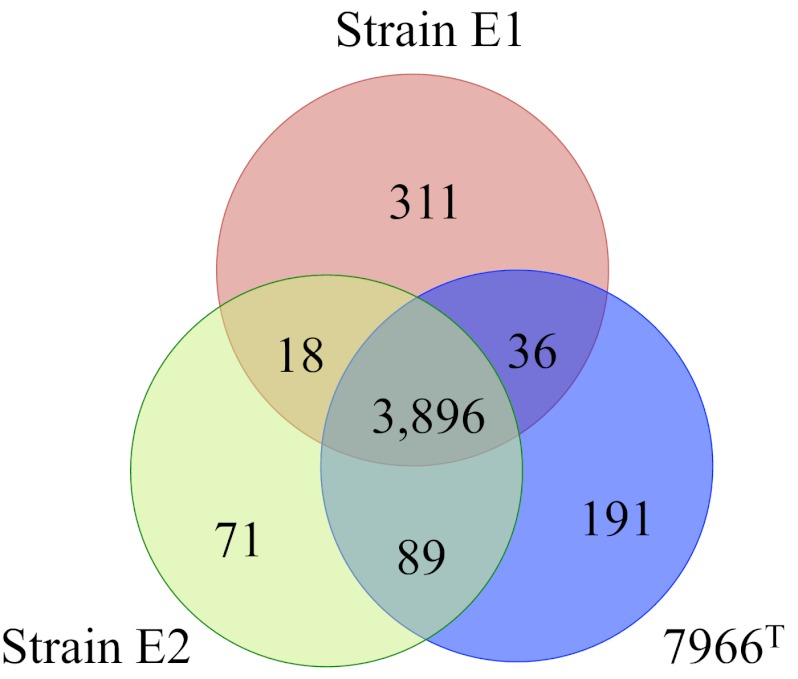
FIG 1 .
Venn diagram of the distribution of protein CDSs inferred from the genomes of A. hydrophila ATCC 7966T, E1, and E2. Numbers of genes unique to and common to ATCC 7966T, E1, and E2 are indicated within the Venn diagram. The values are gene counts following manual curation and differ from the gene counts in the automated RAST pipeline results presented in Table 1.

