
FIG. 4.
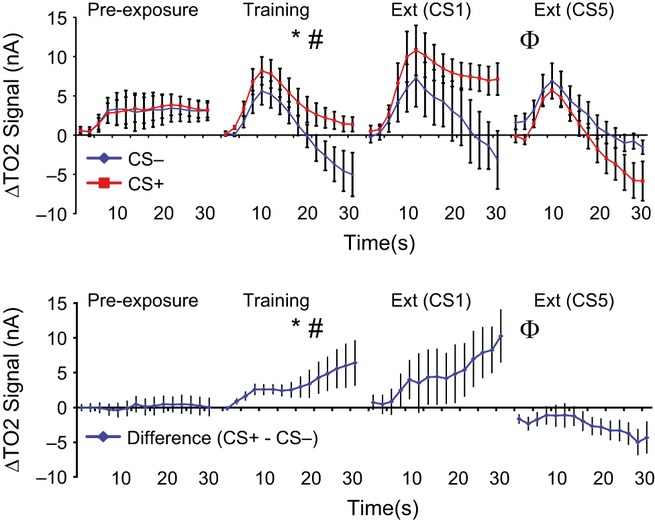
BLA tissue oxygen (TO2) signals. Upper panel: BLA TO2 signals (±SEM) evoked by the CS− (blue) and CS+ (red) during pre-exposure, Day 2 of training, and the first (CS1) and last (CS5) CS− and CS+ trials of extinction. Lower panel: the difference contrast (CS+ minus CS− ± SED) for the BLA data shown in the upper panel. *Main effect of CS, P < 0.05; #CS type × timebin interaction, P < 0.05; ΦCS type × trial number × timebin interaction, P < 0.05. CS, conditioned stimulus.