Figure 2.

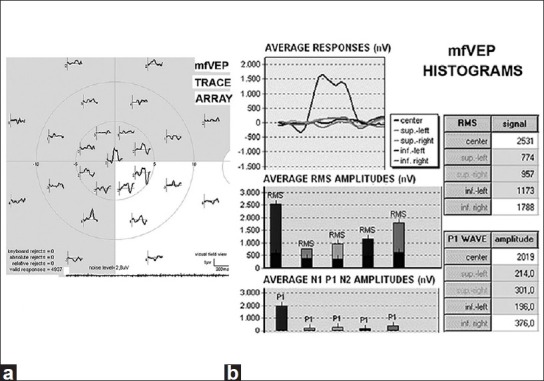
Abnormal decrease and delay at mfVEP. (a) Trace array. (b) Average responses of RMS signals and amplitude, P1 waves, in histograms

Abnormal decrease and delay at mfVEP. (a) Trace array. (b) Average responses of RMS signals and amplitude, P1 waves, in histograms