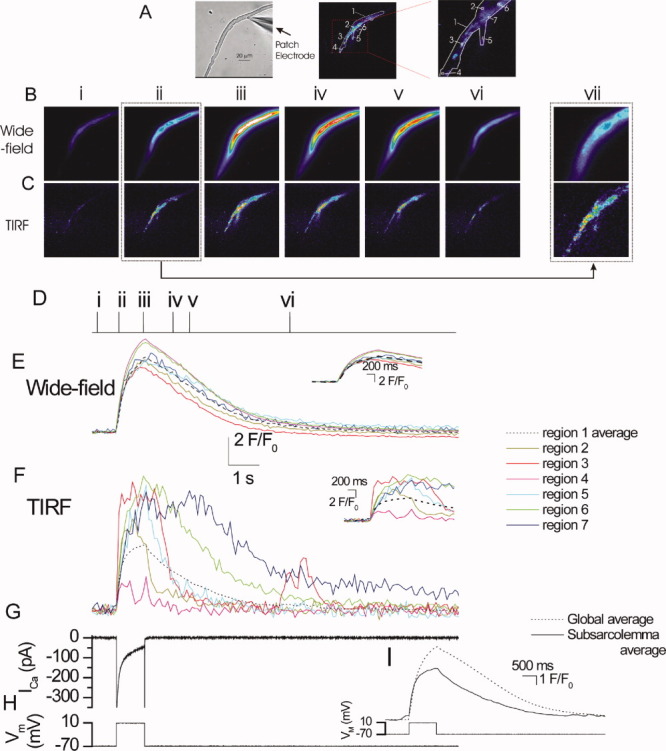
Figure 2.

Simultaneous wide-field epi-fluorescence and TIRF [Ca2+] measurements in a voltage-clamped single smooth muscle cell. Depolarization (−70 mV to +10 mV; H), activated a voltage-dependent Ca2+ current (ICa; G) to evoke a rise in [Ca2+] (B,C,E,F). The rise in [Ca2+] which occurred in the subplasma membrane space (measured by TIRF) (C,F) was more rapid in onset than that seen in the bulk cytoplasm (measured by wide-field epi-fluorescence) (B,E). The [Ca2+] images (B, C) are derived from the time points indicated by the corresponding numerals in D. [Ca2+] changes in B and C are represented by color; blue low and red/white high [Ca2+]. The images (B and C) were taken before (i), during (ii-iii), and after (iv-vi) depolarization and show the resulting [Ca2+] changes. Changes in the fluorescence ratio with time (E and F) are derived from 2 × 2 pixel boxes (regions 1-6 in A, middle and right (expanded) panel; drawn at a 3 × 3 pixel size to facilitate visualization) and from a larger region encompassing the entire TIRF region (region 7). The latter was used to obtain an average subplasma membrane and bulk average [Ca2+]c increase (I). Significantly, although the [Ca2+]c increase which occurred in the bulk cytoplasm (B and E) was approximately uniform and simultaneous throughout the cell, those in subplasma membrane space (C and F) had a wide range of amplitudes and various time courses. Note the spark like events in region 3 toward the end of the recording. (A) left panel show a bright field image of the cell; see also whole cell electrode (right side). Insets in E and F show the rising phase of the transients on an expanded time base. For comparison, I shows the average subplasma membrane and bulk average [Ca2+]c rise as measured in region 7 (A, right hand panel). B and C (vii) shows an enlargement of ii to illustrate the localized nature of the rise in [Ca2+] in the subplasma membrane space (Reproduced from ref. 45, with permission from Rockefeller University Press).
