
Fig. 5.
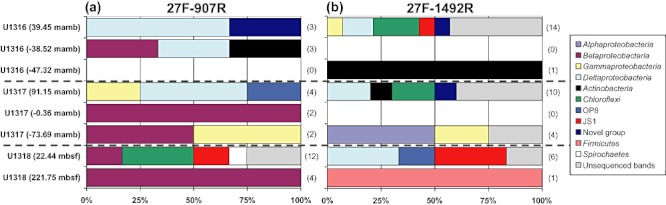
Distribution of bacterial 16S rRNA gene sequences from Challenger Mound sites (U1316 and U1317) and the Reference site (U1318) at different sediment depths using nested PCR-DGGE analysis. a. Nested PCR-DGGE analysis with primer sets 27F-907R and 357F-518R. b. Nested PCR-DGGE analysis with primer sets 27F-1492R and 357F-518R. Numbers of DGGE bands at each depth are shown in parentheses.