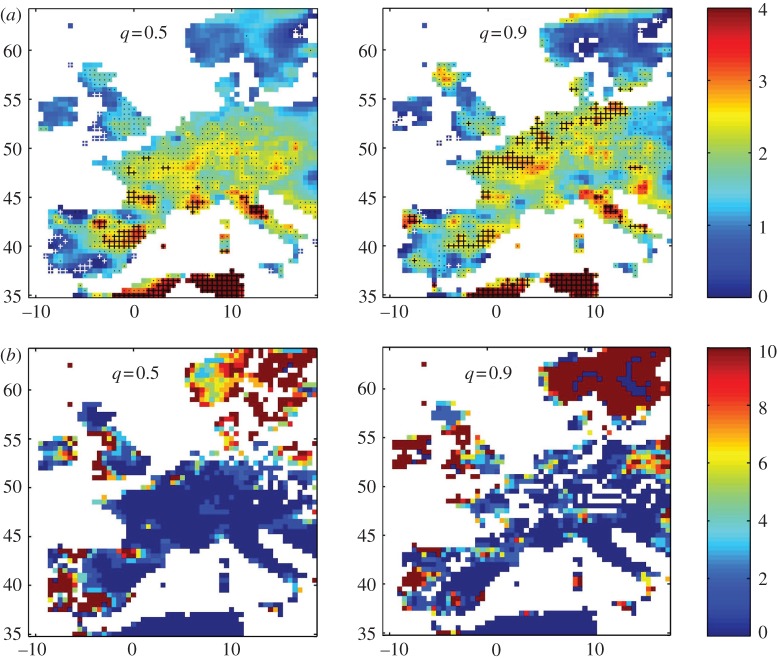
Figure 10.
(a) Local trend parameter S(longitude,latitude,q) in degrees centigrade (indicated by the colour bar) at q=0.5 and q=0.9 for a subset of the E-OBS data. Robustness of these geographical trends (see text) is indicated by locations where in all 10 realizations of this map the magnitude of S>2 (black crosses), S>1 (black dots) and S<1 (white crosses). No data and regions where either |ΔC| or P fall below the threshold are indicated as white space. (b) Percentage likelihood (indicated by the colour bar) that the local trend parameter S(longitude, latitude, q) at q=0.5 and q=0.9 for a subset of the E-OBS data shown in (a) could occur randomly, estimated for 100 realizations of a surrogate dataset obtained by random shuffling of years (see text). No data and regions where either |ΔC| or P can fall below the threshold are indicated as white space. (Online version in colour.)

