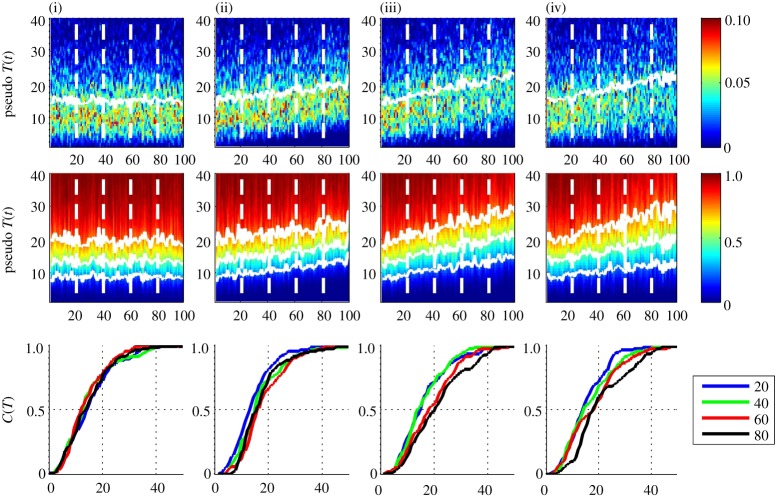
Figure 2.
Pseudo-annual temperature data with (i) no time variation, (ii) constant shift at all temperatures, (iii) mean and variance increase with time and (iv) mean, variance, skew and kurtosis increase with time. The top panel shows the ‘yearly’ (100 sample) pdfs with temperature as ordinate and time as abscissa, with the mean indicated by a white line; the colour bar is pdf value. The middle panel shows the ‘yearly’ (100 sample) cdfs, same axes, with 0.25, 0.50 and 0.75 quantiles indicated by solid white lines; colour bar is cdf value. The four vertical dashed lines at t=[20,40,60,80] indicate the years for which individual cdfs are plotted in the bottom panel. Bottom panel plots these four individual cdfs with temperature as abscissa. (Online version in colour.)

