
Figure 3.
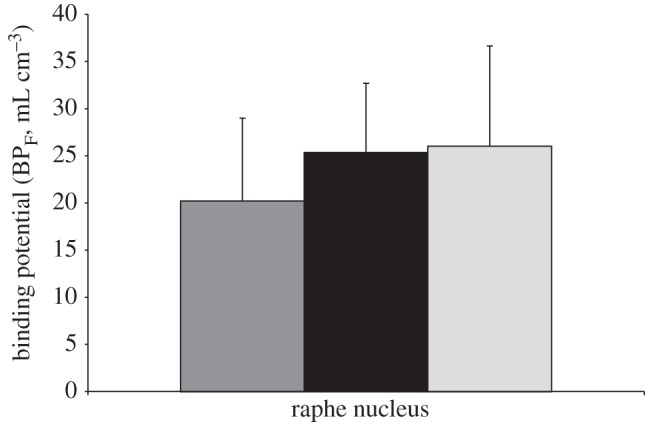
The C(-1019)G 5-HT1A promoter polymorphism in controls and NRM subjects. Binding potential (BPF) shows a stepwise increase in the raphe nuclei with G allele frequency: CC < CG < GG (d.f. = 1,78; F = 7.13; p = 0.009). The height of the bars indicates the weighted mean BPF, while the error bars represent the corresponding equivalent of the standard deviation of each weighted mean. Dark grey bar represents CC (n = 22), black bar represents CG (n = 47) and light grey bar represents GG (n = 11).