
Figure 5.
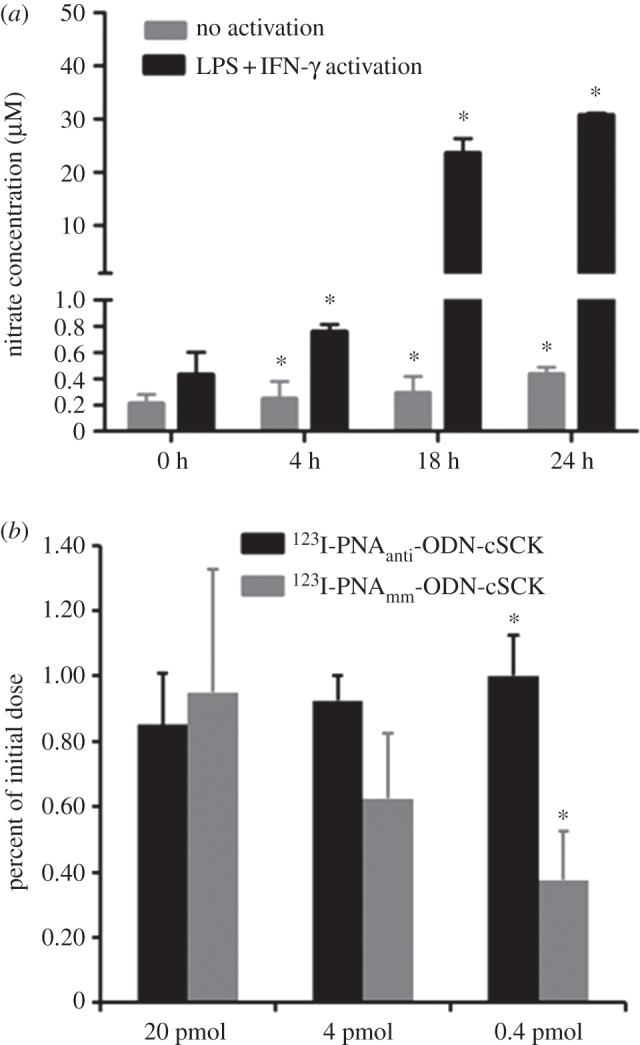
(a) Time course of iNOS expression in RAW264.7 cells with and without LPS + INF-γ activation. (b) Cellular uptake of 123I-PNAantiYR9 · ODNanti · cSCK and 123I-PNAmmYR9 · ODNmm · cSCK. *p < 0.05, n = 3 per group.
Official websites use .gov
A
.gov website belongs to an official
government organization in the United States.
Secure .gov websites use HTTPS
A lock (
) or https:// means you've safely
connected to the .gov website. Share sensitive
information only on official, secure websites.
(a) Time course of iNOS expression in RAW264.7 cells with and without LPS + INF-γ activation. (b) Cellular uptake of 123I-PNAantiYR9 · ODNanti · cSCK and 123I-PNAmmYR9 · ODNmm · cSCK. *p < 0.05, n = 3 per group.