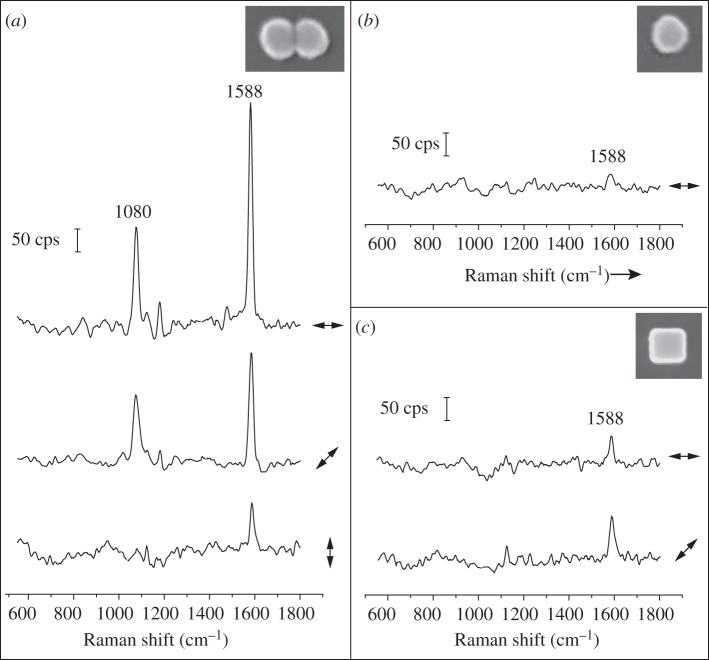
Figure 3.
SERS spectra recorded from individual SERS tags supported on glass slides: (a) dimer tags, (b) sphere tags and (c) cube tags. The double arrows beside each spectrum denote the direction of laser polarization relative to the particle orientation shown in the insets of (a–c), which are the SEM images of the corresponding tags from which the spectra were recorded.

