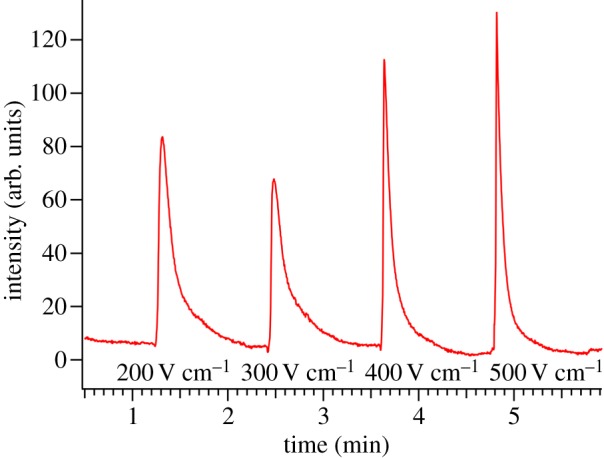
Figure 4.

Electropherograms illustrating the relationship between dispersion of injected lipid (10 μM NBD-PA in 100 μM TBA-TPhB/NMF solution) bands and the magnitude of the electric field driving separation. ΔVinj = 10 V and Δtinj = 1 s. (Online version in colour.)
