Figure 5.
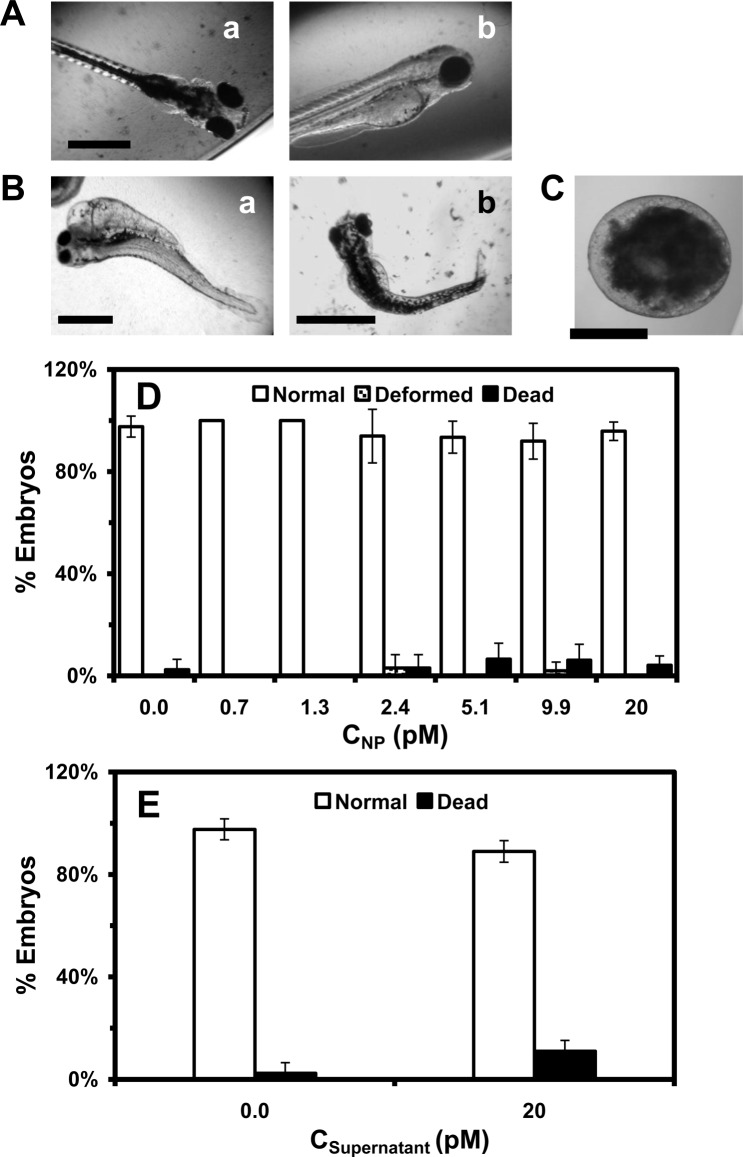
In vivo study of the effect of Au NPs on embryonic development. Optical images of: (A) normally developed zebrafish show normal development of the cardiac region, yolk sac, head and eyes; (B) deformed zebrafish display several deformities, including (a) finfold abnormality, tail/spinal cord flexure, cardiac malformation, yolk sac oedema and eye abnormality; and (b) finfold abnormality and tail/spinal cord flexure; and (C) dead embryo. (D) Histograms of the percentages of the embryos that developed to normal and deformed zebrafish or became dead versus NP concentration. (E) Control experiments: histograms of the percentages of embryos that developed to normal zebrafish or became dead either in egg water alone or in supernatant. A total of 48 embryos were studied for each NP concentration, and control. The percentages of embryos that developed to normal and deformed zebrafish or became dead are calculated by dividing each number by the total number of embryos used at each concentration. Their means and standard deviations (error bars) for each given concentration are calculated from triplicate measurements. Scale bars are: (A) 250, (B) 500 and (C) 200 µm.

