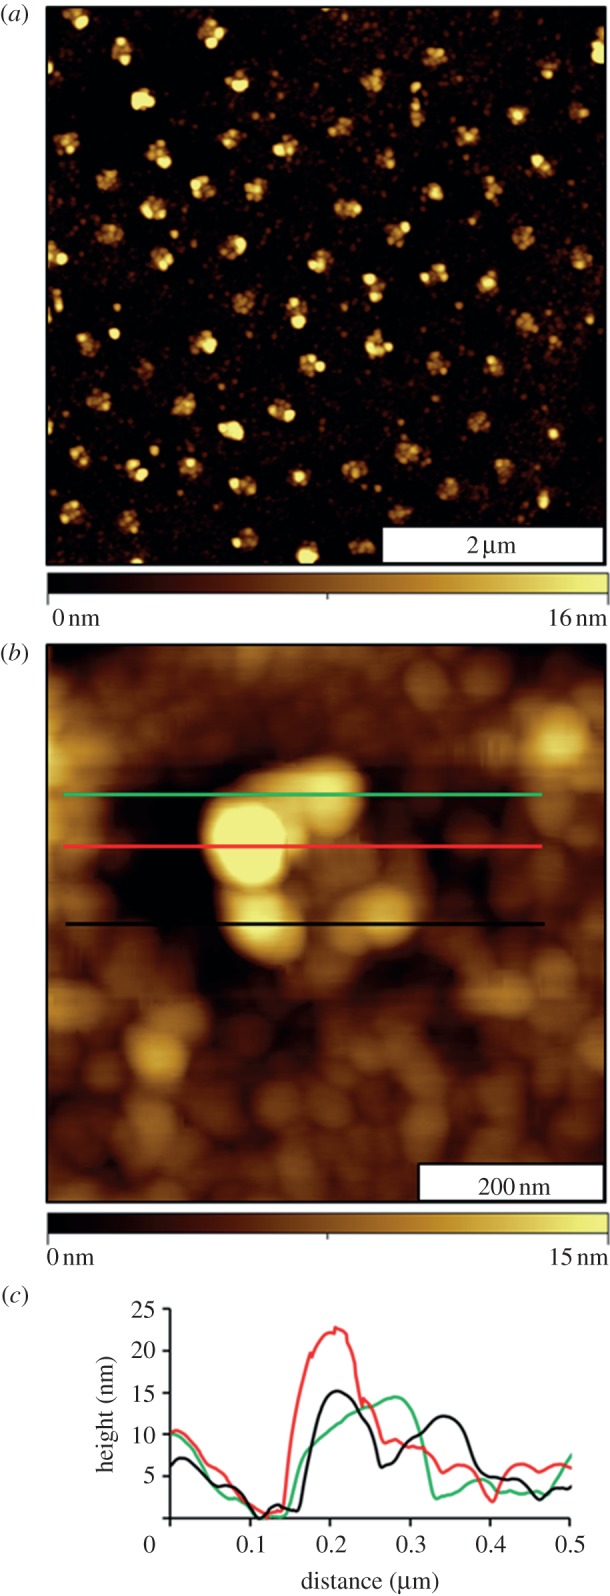
Figure 4.

Changes of the nanostructures after binding antibody. (a) Topography image (5 × 5 µm2) acquired in air; (b) single nanostructure of fibrinogen–immunoglobulin G; (c) height profiles after antibody binding corresponding to the coloured lines in (b).
