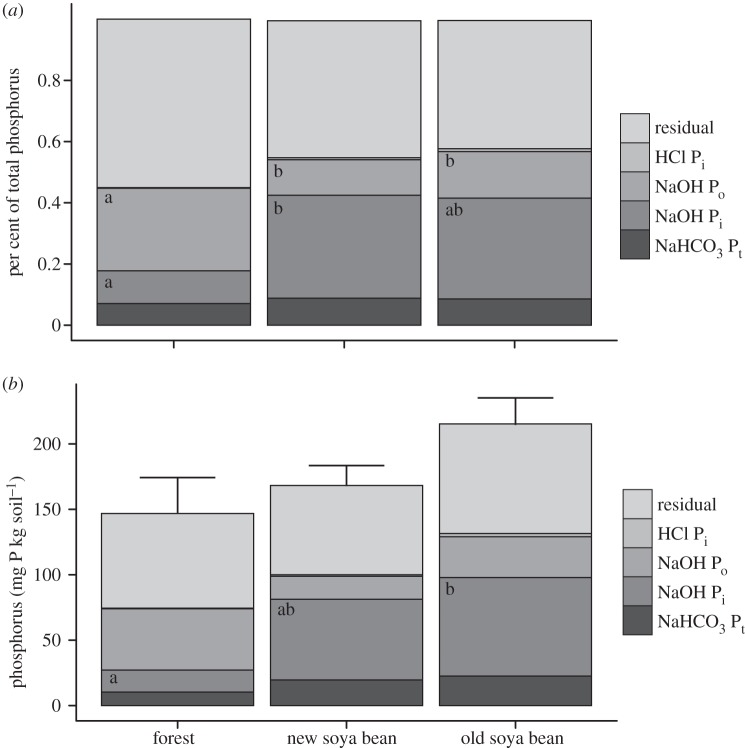
Figure 3.
Phosphorus (P) fraction data as (a) a percent of total P and (b) the concentration of P in each fraction. Land uses from which soils were sampled are forest, new soya bean fields (converted to soya bean in 2007 and 2008), and old soya bean fields (converted in 2003 and 2004). Data are depth-weighted averages of samples from 0 to 20 cm. Soil samples were taken in January and February 2009 at Tanguro Ranch in Mato Grosso, Brazil. Where significant differences exist within fractions among land uses they are represented by letters: where land uses share a letter there is no significant difference (p < 0.05). HCl Pi fractions are difficult to see because there is so little across all land uses.

