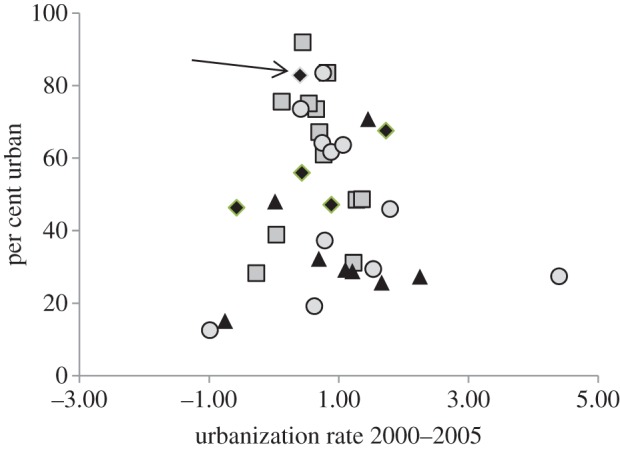
Figure 4.

Average annual rate of urbanization (per cent change) from 2000 to 2005 versus per cent of total population in urban areas in 2000 [43] for tropical forest countries. The arrow indicates the data point for Brazil. Squares, pre-transition; diamonds, transition high; circles, transition low; triangles, post-transition. (Online version in colour.)
