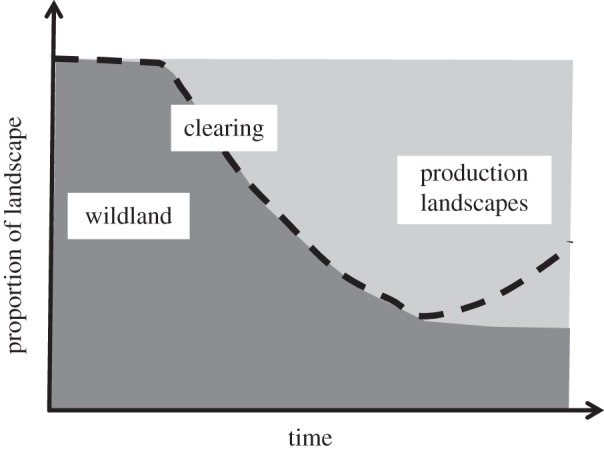
Figure 6.

Schematic of land-use transitions in production landscapes characteristic of Mato Grosso. Dark grey represents forest or other wild lands and light grey represented lands converted to produce commodities consumed in distal locations. Dashed line is trajectory of forest cover following traditional forest transition theory.
