
Figure 6.
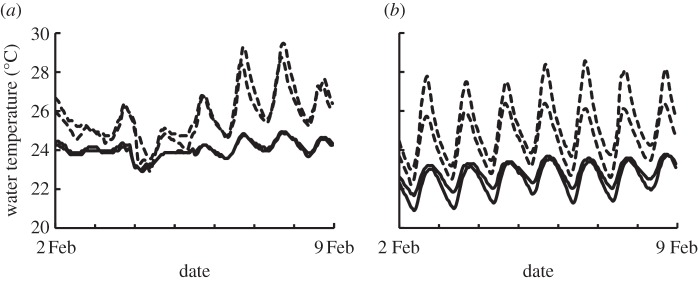
Streamwater temperatures in two forested (solid lines) and soya bean (dashed lines) watersheds over 7 days in the (a) wet and (b) dry season. Patterns in the first few days of the wet season record coincides with rain events. Data from [29].