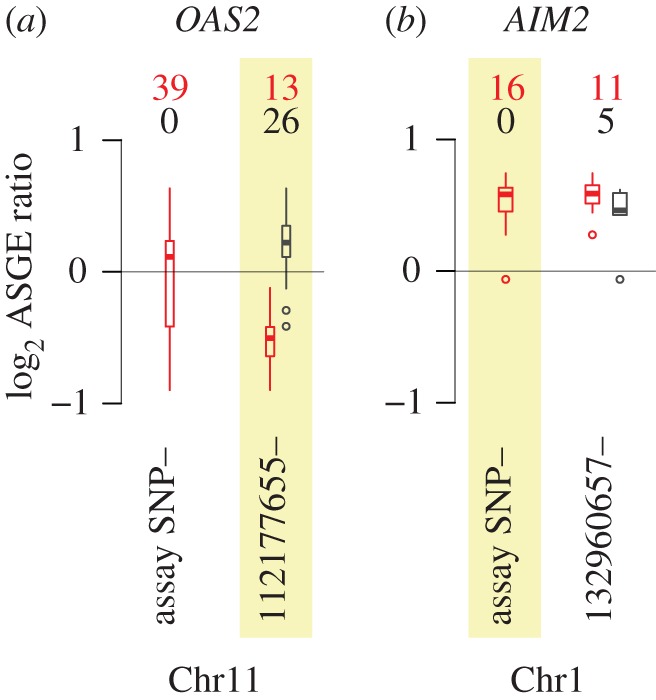
Figure 2.

Example genetic associations with ASGE. (a) Variation in the ASGE data for OAS2 is best explained by heterozygosity/homozygosity at a SNP contained in the captured, resequenced region upstream of the OAS2 transcription start site (r2 for a model including the best site in the resequencing data = 0.54 versus r2 for a model including the assay SNP = 0.01). (b) Variation in the ASGE data for AIM2 is best explained by heterozygosity/homozygosity at the assay SNP, and not at any SNP in the captured, resequenced region (r2 for a model including the assay SNP = 0.88 versus r2 for a model including the best site in the resequencing data = 0.73). (a,b) In both panels, boxplots show the range of ASGE variation across all assayed individuals (left: ‘assay SNP’) and ASGE variation subdivided by a SNP in the captured, resequenced region (right: base pair coordinates for these SNPs are provided as labels). Numbers above each set of boxplots provide the number of heterozygotes (red) and homozygotes (black) for each site, and the site associated with the best ASGE partition is highlighted in yellow. For the assay SNP, all assayed individuals are heterozygous because assay SNP heterozygosity is a requirement for the assay to be performed. Boxplots represent the data distributions as follows: heavy bars show the sample median; boxes cover the interquartile range of the data and whiskers extend to the most extreme data point (excluding outliers that were more than 1.5 times the interquartile range from the box; small open circles mark outliers beyond this range).
