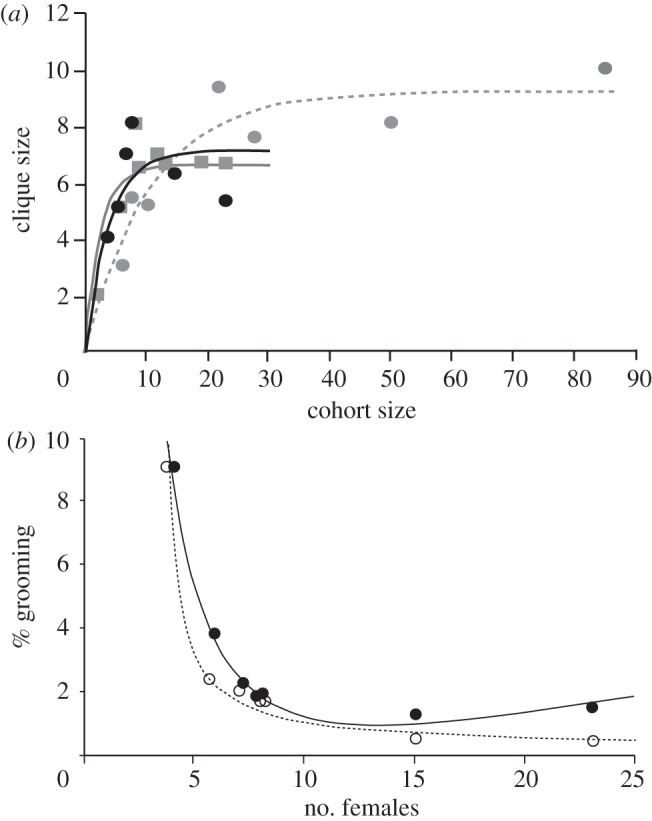
Figure 1.

(a) The relationship between clique and cohort size, together with exponential growth curves, in vervets (black circles, black solid line. Clique size for the Loskop troops were: Picnic = 4, Donga = 5), baboons (grey squares, grey solid line) and macaques (grey circles, grey dashed line). Macaque data are from Nakamichi & Shizawa [5] and represent a mixture of wild, provisioned and captive troops. Baboon data are from wild troops in Drakensberg National Park, South Africa [4], De Hoop Nature Reserve, South Africa (S. P. Henzi and L. Barrett 2007, unpublished data), Moremi Game Reserve, Botswana [23], Mountain Zebra National Park, South Africa [7] and Tana River Forest Reserve, Kenya (V. Bentley-Condit 1992, unpublished data). (b) The relationship between cohort size and the mean percentage of social time in vervet monkeys available to each female were she to allocate time only to other clique members (solid line, solid circles) or to all other adult females (dashed line, open circles) equally. Data come from Samara, Loskop and Amboseli (time-budget values for Amboseli taken from Isbell & Young [24]). The best-fit curve for the restriction of grooming allocation to other clique members is described by the equation: y = 1.72 + 1.365 × x + 1.64/x2 (r2 = 0.99), while that available if time is allocated to all other cohort members is: y = 1/(9.22 + 7.44 × ln(x)) (r2 = 0.99), where y is proportion grooming time and x is number of females groomed.
