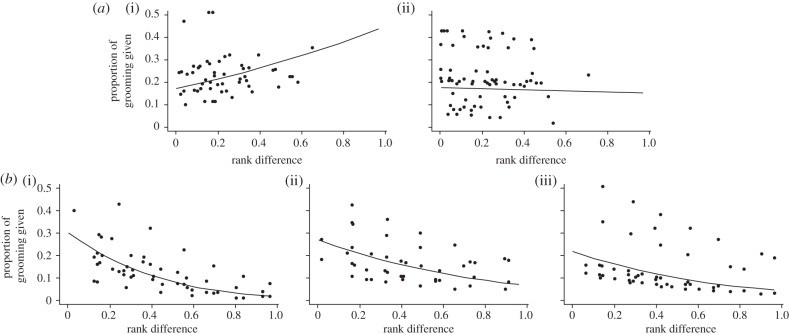
Figure 3.
Fitted (lines) and observed (points) proportion of grooming given depending on the standardized rank difference between the receiver and the giver i at (a) Samara ((i) RBM, (ii) RST) and (b) Amboseli ((i) AmbA, (ii) AmbB, (iii) AmbC). Fitted values are modelled using the best-fitting generalized mixed effect model in table 2.

