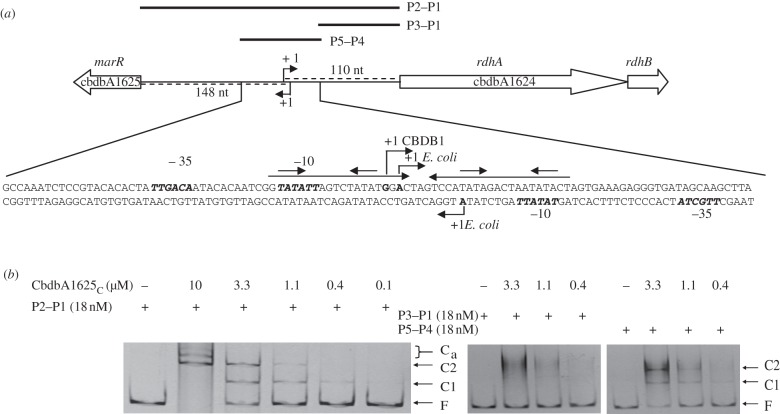
Figure 3.
(a) Schematic of the intergenic region of cbdbA1624–cbdbA1625. The DNA sequence shown depicts the P5–P4 region. The long horizontal arrows above the sequence indicate inverted repeat sequences in the promoter region; the angled arrows indicate the experimentally determined transcriptional start sites; the short arrows above the inverted repeat sequences represent the putative recognition sequences of the regulator; bold and italic letters depict the consensus sequences of the −10 and −35 region predicted by the BPROM software (http://linux1.softberry.com/berry.phtml). The complete intergenic region (246 bp; P2–P1) and sub-fragments thereof (P3–P1/P5–P4) were amplified by PCR from total DNA of strain CBDB1 with primers binding in, or flanking, the intergenic region for EMSA. (b) Interaction of Strep-CbdbA1625C with the complete intergenic region (P2–P1) and the sub-fragments (P3–P1/P5–P4). EMSA was carried out in the presence (plus symbols) and absence (minus symbols) of Strep-CbdbA1625C protein. Free DNA (F) and retarded DNA–protein complexes (C1, C2, Ca) were visualized by staining with GelRed (Biotium, Hayward, CA, USA).

