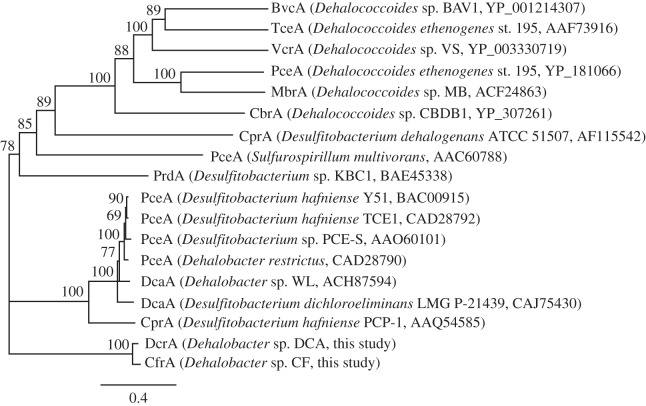
Figure 6.
Maximum-likelihood phylogenetic tree of the RDases that have functional characterization. The alignment was generated using the MUSCLE algorithm, and the tree generated using the PhyML plugin in Geneious under the WAG model of evolution. Bootstrap support values (from 100 bootstrap iterations) are indicated where greater than 50 per cent. The scale bar represents the average number of substitutions per site. For a complete tree of curated RDase sequences see the introductory chapter to this issue [35].

