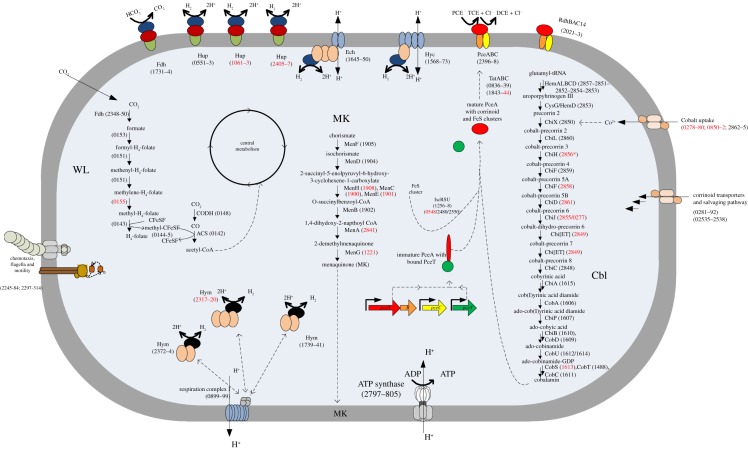
Figure 1.
Metabolic map showing selected pathways of D. restrictus. Metabolic pathways, both predicted from D. restrictus genome and analysed by functional genomics, are presented in a simplified bacterial cell. The cytoplasmic membrane is depicted in grey, the cytoplasm in blue shading. Dehalobacter restrictus genomic loci (Dehre_#) are indicated in parentheses, with black label showing proteins detected in the proteomic analysis and those not detected indicated in red. Three important pathways are given in detail: the Wood–Ljungdahl pathway (WL), the menaquinone biosynthesis pathway (MK) and the corrinoid biosynthesis pathway (Cbl).

