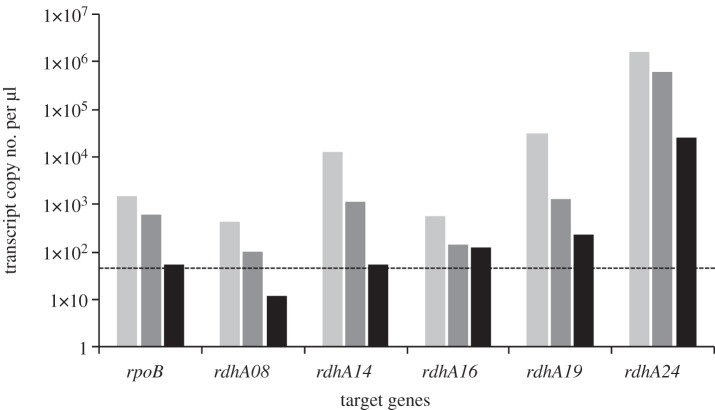
Figure 5.
Growth-phase-dependent transcription level of selected rdhA genes in D. restrictus analysed by RT-qPCR. The graph depicts the gene copy number of selected rdhA genes along with rpoB as control obtained from one culture replicate harvested in exponential (light grey), late-exponential (dark grey), and stationary (black) phases, respectively. The same trend was observed for all replicates. Standard deviation of qPCR replicates was below 15% of the measured data. The dotted line (50 copies μl−1) displays the lower detection limit that was generally considered for the data obtained.

