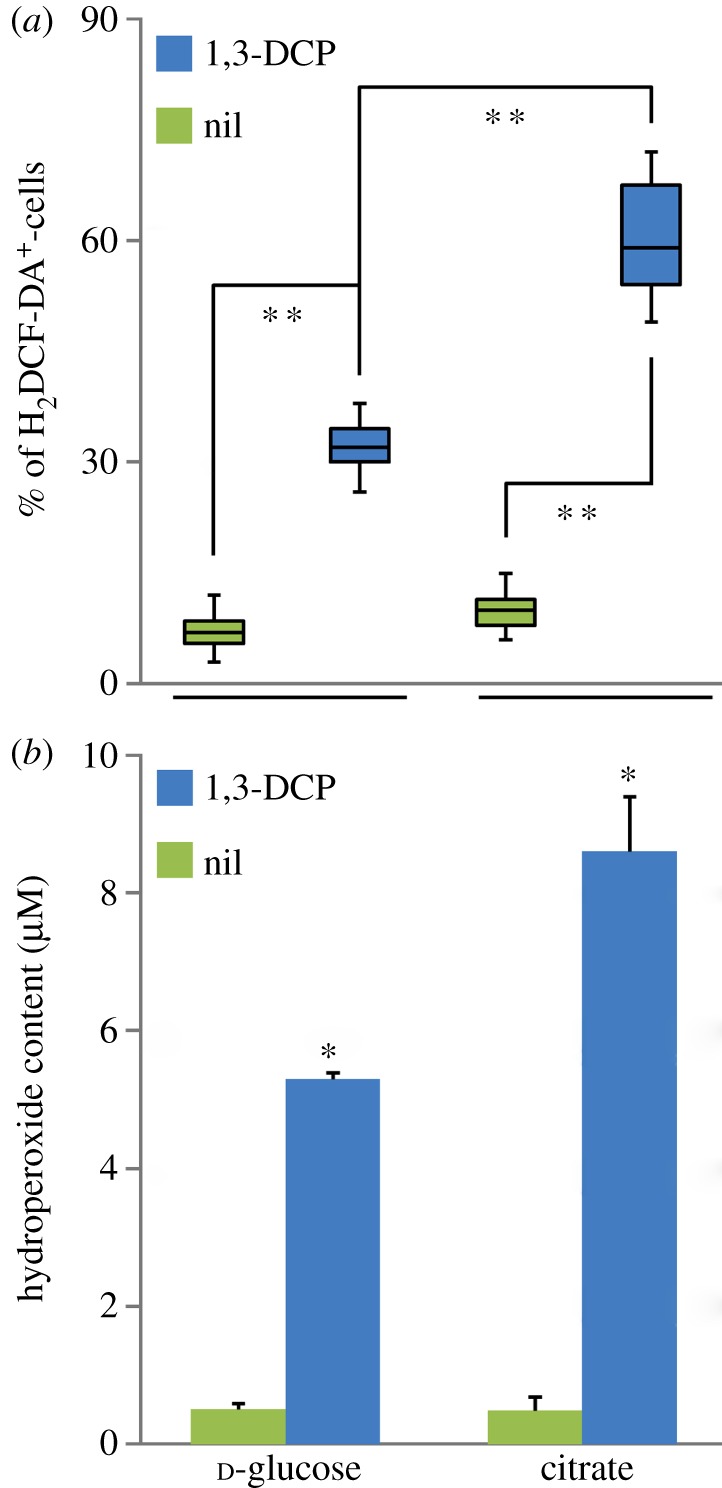
Figure 4.

Evaluation of stress parameters in P. pavonaceae cells growing exponentially on MMY medium containing either 30 mM d-glucose or citrate (i.e. glycolytic and gluconeogenic metabolic regimes) under control conditions (nil) and in the presence of 0.5 mM 1,3-dichloroprop-1-ene (1,3-DCP). (a) Fluorescence-activated cell sorter cytometry analysis was performed to identify stressed bacterial subpopulations in vivo using the fluorescent dye 2′,7′-dichlorodihydrofluorescein diacetate (H2DCF-DA), which is activated upon exposure to ROS. Box plots represent the median value and the first and third quartiles from at least five independent experiments performed in triplicates, and the asterisk denotes significant differences among treatments at the 99% level as evaluated with the Mann–Whitney U-test. (b) In vitro determination of the total hydroperoxide content in the cells by means of the FOXII reagent, based on the formation of a stable Fe3+–xylenol orange complex. Each bar represents the mean value of the hydroperoxide content (expressed as equivalents of tert-butyl hydroperoxide) ± s.d. of duplicate measurements from at least three independent experiments. The asterisk denotes significant differences in the hydroperoxide content at the 95% level when compared with the control culture (without 1,3-DCP), as evaluated with ANOVA.
