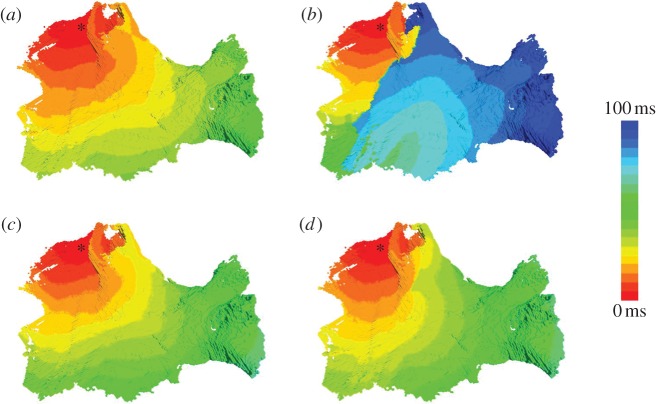
Figure 5.
Activation patterns in the canine PV region. Simulated activation times in the three-dimensional model are shown using a standard rainbow palette. The activation time at each voxel is measured as the interval between the stimulus application and the AP initiation in that voxel. The stimulation site is shown with an asterisk. The anatomical tissue orientation is the same as in figures 3 and 4. (a) Normal activation after the last of three baseline S1 stimuli—details of the propagation pattern are shown in figure 3. (b) Re-entry generation after an ectopic S2 stimulus (short-coupled at 90 ms)—details of the propagation pattern are shown in figure 4. (c,d) Quasi-normal activations after an ectopic S2 stimulus (short-coupled at 90 ms) in the homogeneous and isotropic models, respectively. Ectopic S2 stimuli in (c) and (d) result in activation patterns similar to those seen during baseline S1 stimulation in (a). Such quasi-normal activations are observed in our simulations of the homogeneous and isotropic models with any S2 coupling interval leading to AP conduction.

