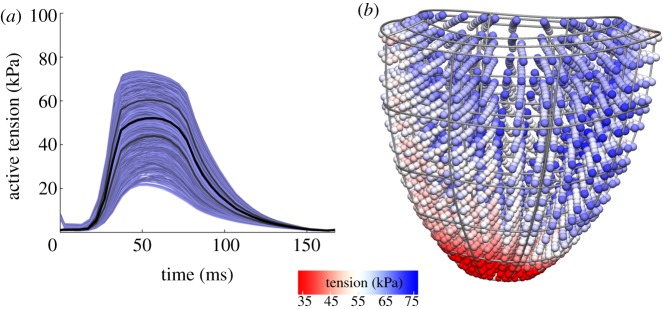
Figure 3.

Heterogeneity of tension development. (a) Default simulation results showing a large heterogeneity in tension generation in the myocardium. The graph shows tension development in all Gauss points of the elements not adjacent to the apex or base, to reduce the effects of boundary conditions. The black line indicates mean tension, and the grey lines indicate mean ±s.d. (b) Three-dimensional visualization of the complex apex-base and transmural heterogeneity in this distribution. This visualization shows the distribution of active tension at the time point of maximal mean active tension.
