Figure 4.

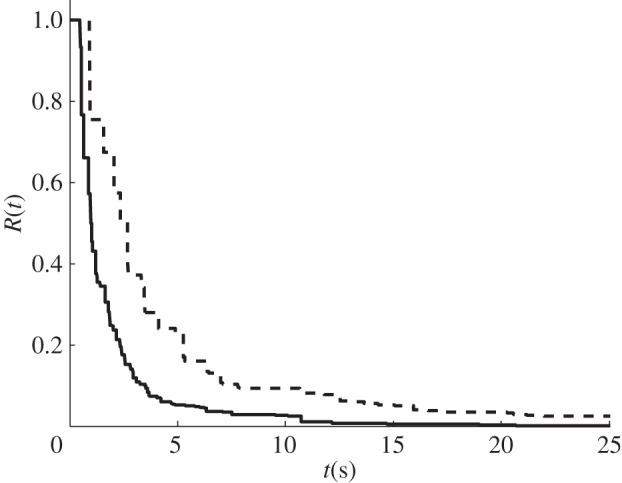
Plot of R(t) for a randomly chosen sample capillary network for a normal (solid line) condition and for a 20% (dashed line) blockage.

Plot of R(t) for a randomly chosen sample capillary network for a normal (solid line) condition and for a 20% (dashed line) blockage.