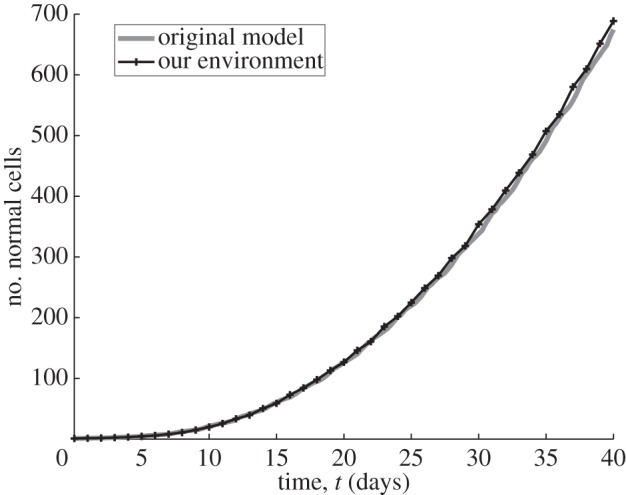
Figure 6.

Normal cell proliferation for 100 realizations, in a two-dimensional lattice of size [100 × 100], with carrying capacity per lattice site equal to 1. The simulation was run for a period equivalent to 960 h and the cells' random motility coefficient D was set to zero and dt= 0.5 h. The simulation starts with a single cell placed in the middle of the lattice. The graphs show the mean value of 100 realizations. The parameters for the cell cycle are those defined in table 1 for normal cells. The oxygen concentration is fixed at 30 mm Hg.
