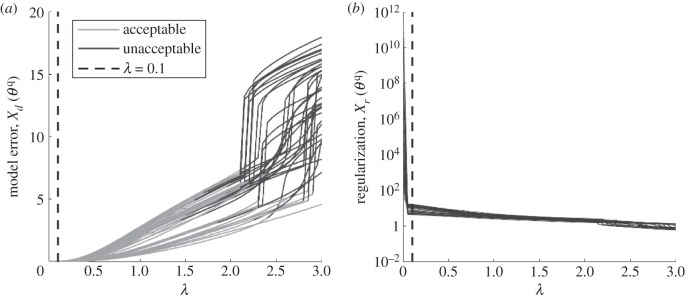
Figure 11.

Effect of regularization strength λ. Here λ = √λr is shown on the horizontal axis. (a) Model error Xd for all acceptable parameter sets for increasing λ, where light grey indicates an acceptable data fit and dark grey an unacceptable data fit. (b) Regularization error Xr for increasing λ, resulting in a so-called Pareto frontier. Any point on the frontier curve is Pareto efficient and it is up to the user to make trade-offs and select which λ is used. The dashed line indicates the λ that was selected (λr = 0.01). Adapted from Tiemann et al. [10].
