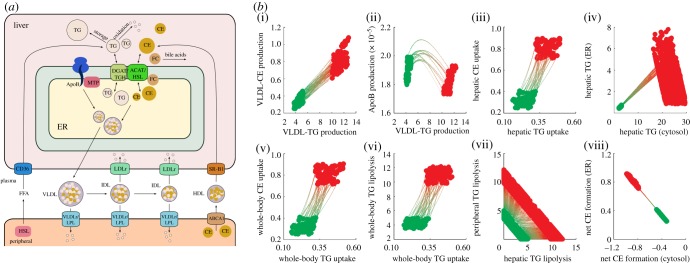
Figure 9.

(a) Schematic overview of the model of hepatic lipid and plasma lipoprotein metabolism in mice. (b) Identified flux adaptations upon T0901317-induced LXR activation. Flux trajectories from the control phenotype (light grey) to the LXR-activated phenotype (dark grey). Molecular fluxes ((i)–(iii), (v)–(viii)) are given in mM/h, whereas the triglyceride concentrations presented in (iv) are given in mM (for details, see [10]). Figures adapted from Tiemann et al. [10]. (Online version in colour.)
