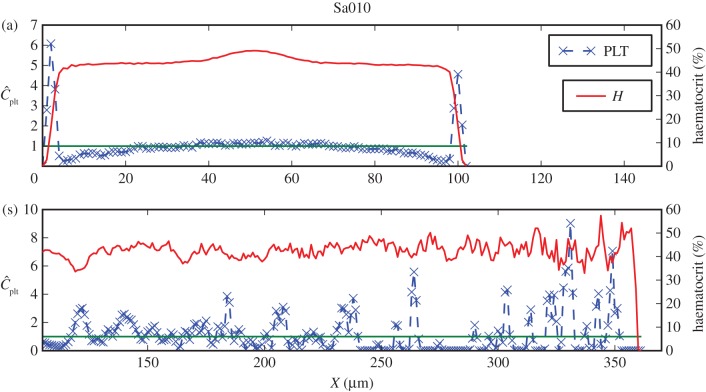
Figure 5.
Haematocrit and normalized platelet concentration for Sa010 cross sections marked in figure 4(i). Shown are (a) the distributions in the parent vessel with a clearly visible margination of platelets, and (s) the cross section containing parts in the recirculation and the stagnation zones. The green line refers to the mean platelet concentration (  ).
).

