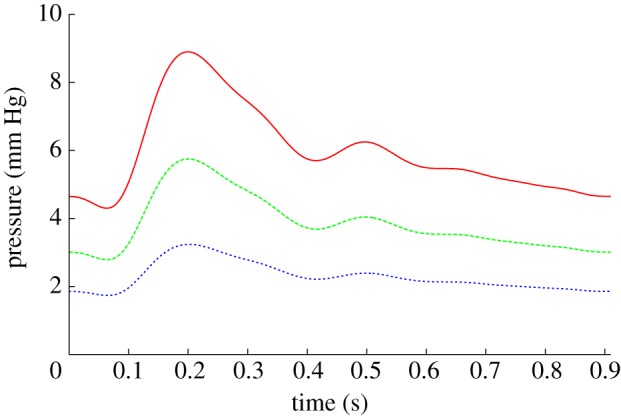
Figure 4.

Pressure differentials, relative to outlet D, obtained from the one-dimensional model at the inlet and outlets. Simulations were run for a total of three cardiac cycles. Inlet A, solid line; outlet C, dashed line; outlet E, dotted line. (Online version in colour.)
